

The main goal of ISS is to achieve the best performance possible and at the same time safe-guard the server from overloading and running out of resources.
For ISS to be able to do this it must have some knowledge of how the server it doing, performance-wise, on the execution of the processes that ISS manages. A key piece for this to be possible is the Performance Monitor inside ISS.
ISS has a built-in statistical agent. The ServiceStatistics (see JavaDoc).
Every executed process get's it's execution time since delegation recorded by this engine and an average of process execution times is always kept by a fast calculation method.
This method is configured by default to keep the average process execution time for the last 100 processes. This default number has been defined since we want a rapid response to performance changes in the server but need a significant amount of samples to prevent a "performance spike" to influence our configuration. This and many other parameters can also be provided for a tunned ISS manager for your real-world application.
In order to leave no suspicion performance-wise on the statistical agent we'll describe the calculating algorithm that is in place to do so. This will also help you know what parameters to give ISS in order for the statistical data to reflect what you want, and how fast you want it to.
To avoid having to analise large number of samples to calculate the statistics thus having a time consuming statistical engine we decided to separate the collected performance data in groups of samples. The number of these groups and how many samples are contained in each one is configurable by the parameters we provide the ISS instance.
The relevant parameters are the following:
The ServiceStatistics (see JavaDoc) is called after the execution of each processes to add the performance sample to the current group. This is done in the less time-consuming way possible.
The addSample method adds the sample to the current group sum control variable and increments the current group number of samples. Each add operation is a simple addition and an increment of a counter. When the samples per group total is reached the current group is pushed into a groupQueue for later reference, and it's total of samples and sum of execution times are added to the global sample counter and global execution time total. These are the ones use by the Statistical Engine to calculate the Mean execution time of processes.
The groupQueue is kept so we can rotate the group totals. We want to maintain a "numberOfGroups x elementsPerGroup" statistical mean execution time. Since we keep only the relevant data, the totals, we need to decrement the totals of each group that are no longer relevant. When a new group is added to the global control counters and the numberOfGroups has been reached, we retrieve the old group from the queue in order to subtract it's performance values from the global control counters and after add the new group data to the same control variables.
This algorithm is in fact very simple and presents a way in witch to keep the data needed for ISS with the least possible effort since performance is our goal.
As you might have notice with the previous description the two parameters that allow us to configure the Statistical engine are of the maximum relevance.
As always a one size fits all solution is not possible. When maximum performance is needed you should take some time do determine what are the best values that give you the desired statistical information. As you'll see next this is crucial to ISS's management.
ISS uses the statistical data provided by the ServiceStatistics to determine when the load of the server is within expected performance parameters, or when it's not.
So as you can see much depends on the statistics data.
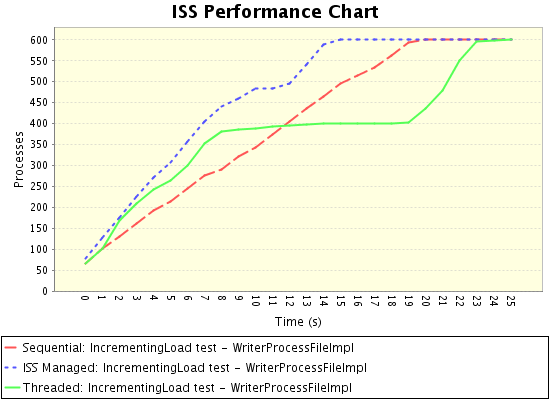
What we wish to get is something like the next graph. In it you can see where the load became to much for the server and how ISS management was able to keep the performance at the best level even with a large number of processes being delegated in a small amount of time. For more on this graph please see the Sample Application section with explains what was ran in order to produce this output.
As stated in the How it works section ISS dumps statistical data periodically to the log output when configured to the Info level or bellow. This data is intended to help administrators on monitoring the server's load, and even allow them to come back at a later time when someone reports a problem in a given time period to see the collected data that ISS dumped in order do do a post-diagnostic of a hipotetical performance issue.
Since the logging operation can generate much verbosity in the logs, the ISS team decided to issue a statistical data dump 1 out of every 5 performance reavaluations ISS does (witch happen once for every 20 synchronous processes executed and one for every asynchronous process). This is a conventioned behaviour that at the moment the team has seen no need to allow configuration. If the need arises we may reevaluate this decision.
Here is a sample of the output done by ISS to the log:
Data collected at: Sunday, Aug 26 2007 - 16:44:07
--------------------------------------------------------------------------------------------------------------
Asynchronicity Threshold was 3 and now is 3 [1-3]
Number of requests in synchronous service: 1
Waiting queue size: 0
Number of workers handling asynchronous requests: 0
Mean service execution time: 44 (ms) [500-1000]
--------------------------------------------------------------------------------------------------------------