

The ISS can be used in any Java framework of your choice. To keep things simple we won't use any of them.
This example uses a simple class that tests the performance of ISS in a specific scenario.
The application launches a few hundreds of processes to execution. The processes are executed 3 times at different conditions/strategies:
All these tests are then repeated with a slightly different processes type to execute. An incrementing load processes. A processes that each time it's executed executes a longer and heavier task.
The class defines a few constants that enable anyone to tune the application to perform the same tests with different loads. The following are configurable:
Let's analise the details of how the Sample Application does what it's supposed to do.
The application is centered in the ISSPerformanceTester class (see it's source here ).
It launches several processes that are implementations of the IProcess interface that ISS specifies, using several helper classes that we will refer next.
It then generates 3 different sets of statistics of the results it gathered, as we will see later on.
The process we used for testing performance was a simple one. It just writes a sequence of strings to a specified container.
For different testing purposes we have two process types. They are basically the same. The only difference is that one has a memory-based container (an array of Strings) and the other a file-based container (a text file). To simplify the implementation the common methods of these two are implemented in a BaseWritterProcess class.
These are the implementations:
They both support the same load and incremental load feature.
The Sample Application bundled in the Downloads section uses the File-based implementation. You can change this simply by changing the class that is passed to the ExecuteProcesses method of the ISSPerformanceTester class.
Note: Beware on using the Memory-based implementation that you can easilly crash your JVM with out of memory errors. This is the reason for the default bundled version of the Sample Application to be configured for the usage of the file-based implementation. Using the memory-based one you will find that few processes will be executed very fast, putting the multi-threaded test with the best results, too much process will overflow the JVM's memory crashing it, and in a very thin barrier in between it will show a few errors or none on the multi-threaded test, but a very slow response when compared with the ISS managed test. This is because the JVM will pressed on with occupied resources and thus render a much slower response. Monitor the RAM data that is printed in the log and you will see the enormous amount of RAM that the JVM will be forced to allocate.
When executing the processes in ISS/Threaded execution mode, we have to simulate parallel requests made at the same time. In order to do so a helper class was implemented. The myProcessCaller .
This class launches a thread that either executed the process or delegates it to the ISS, depending of the mode we're testing. It has a few helpful features, but is basically an implementation of the execution of a given process in a new Thread.
Finnally what happens to the result of the performance tests? We should compile them for latter analysis.
Well the ISSPerformanceTester application does preciselly that... and more!
The application compiles the results (execution time) in series of data. It compiles them in a given number of samples (configurable).
It then proceeds by creating three different outputs of this statistical data:
All these are saved in the current folder, save the ASCII art that is sent to the standard output stream (System.out).
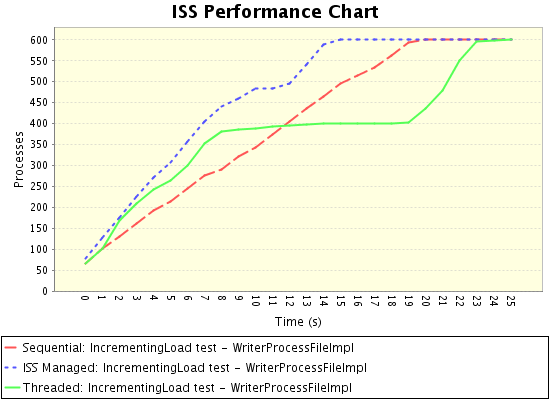
 Sequential: IncrementingLoad test - Writ |    75  114  150  187  224  261  298  333  371  408  445  482  516  553  589  600  600  600  600  600
 ISS Managed: IncrementingLoad test - Wri |    72  140  177  213  250  287  322  358  395  431  468  505  541  578  600  600  600  600  600  600
 Threaded: IncrementingLoad test - Writer |    79  126  173  242  317  361  404  436  441  443  445  449  450  453  453  468  478  480  600  600
                                          ------------------------------------------------------------------------------------------------------------
                                                0    1    2    3    4    5    7    8    9   10   11   12   14   15   16   17   18   20   21   22 (s)
If you want to play around with this example you can download it at the Downloads section.