

Description: Chart component for creating server-generated-images of visually appealing charts.
JavaDoc: Click here
Remarks: The charts are rendered as plain images. These are rendered by an internal DiF provided servlet that the component integrates into the page.
If the chart appears like a broken link image, you should check the servlet declaration. See more on this bellow.
All charts are rendered with an anti-aliasing 3D engine for best graphical output. The chart engine provides abundant chart types and configurations, but, for the moment, the chart component only exposes to the developer 3 types and limited configurations. Please contact us with your necessities, or better, contact us on how you can add your own needs to the Chart component witch we will then integrate in the main stream version.
Body content: Empty. All enclosed content will be ignored.
Attributes:
| Name | Description | Data type | Required | Default value |
| id | The name (identifier) of the chart | String | Yes | - |
| type | Chart type. See bellow a list of supported types. | ChartType | Yes | - |
| label | The label for the chart alternate image | String | Yes | - |
| dataEventID | The event method (@OnDocument) that provides the data for the chart. | String | Yes | - |
| chartDefinition | The method that provides the chart definition (will override the dataSeries parameter). | ChartDefinition | Yes | - |
| categoryLabelOrientation | ChartLabelOrientation | No | - | |
| chartBackgroundColor | The Chart background color | Color | No | - |
| chartOrientation | The chart render orientation | ChartOrientation | No | - |
| limitToTop | Sets a limit for the elements to show on the chart to the Top X values | Integer | No | - |
| minumumValue | The bottom limit to render on the chart | Double | No | - |
| othersDescription | When limitToTop and showOthersElement are enabled this is used to customize the others element title | String | No | - |
| pieRenderOrigin | The angle origin where the pie slices begin to draw | Double | No | - |
| render3d | Render the chart in 3D | boolean | No | false |
| showLegend | Show legend | Boolean | No | false |
| showOthersElement | hen limitToTop is enabled if T will show an others element with the sum of all other values | boolean | No | false |
| stacked | Render series on top of each other | boolean | No | false |
| titleXAxis | The X axis title | String | No | - |
| titleYAxis | the Y axis title | String | No | - |
| unit | Unit of the provided values if needed (i.e. sec, Mb, Eur.) | String | No | - |
| exportToExcel | Add a link to export the Chart data to Excel | Boolean | No | False |
| width | The width in pixels for the chart to generate | Integer | Yes | - |
| height | The height in pixels for the chart to generate | Integer | Yes | - |
Examples:
View - JSP file
<dif:document>
    <dif:chart id="classificacao" label="Classification stats"
               width="400" height="280" type="<%=ChartType.BAR%>"
               data="${stage.classificationStats}" />
    <dif:chart id="recomenda" label="Recomends stats"
               width="400" height="280" type="<%=ChartType.PIE%>"
               data="${stage.recomendsStats}" />
</dif:document>
Stage - Class file
public class SomeStage {

    (...)

    public Map<String, ChartDataSeries> getClassificationStats() {
        Map<String, Double> data = new LinkedHashMap<String, Double>();

        Long interest = 0L;
        Long clarity = 0L;
        Long knowledge = 0L;
        Long duration = 0L;

        for (Answer answer : answers) {
            interest += answer.getInterest();
            clarity += answer.getClarity();
            knowledge += answer.getKnowledge();
            duration += answer.getDuration();
        }

        data.put("Interest", new Double(interest) / answers.size());
        data.put("Clarity", new Double(clarity) / answers.size());
        data.put("Knowledge", new Double(knowledge) / answers.size());
        data.put("Duration", new Double(duration) / answers.size());

        return new ChartDataSeries("", data);
    }

    public Map<String, Double> getRecomendsStats() {
        Map<String, Double> data = new HashMap<String, Double>();

        Double yes = 0.0;
        Double no = 0.0;

        for (Answer answer : answers) {
            if (answer.getRecomends())
                yes++;
            else
                no++;
        }

        data.put("Yes", yes);
        data.put("No", no);

        return new ChartDataSeries("", data);
    }
}
web.xml configuration:
The following should be added to your web.xml in order for the charts to be rendered.
Projects created with the provided DiF archetypes should already contain this entry.
<?xml version="1.0"?>
<web-app version="2.4" xmlns="http://java.sun.com/xml/ns/j2ee" xmlns:xsi="http://www.w3.org/2001/XMLSchema-instance"
    xsi:schemaLocation="http://java.sun.com/xml/ns/j2ee web-app_2_4.xsd">
    <description>Sample Web application descriptor for DIF Presentation testing purposes</description>

        ...

    <!-- Chart tag servlet -->
    <servlet>
        <servlet-name>chart</servlet-name>
        <servlet-class>pt.digitalis.dif.presentation.views.jsp.taglibs.chart.ChartServlet</servlet-class>
    </servlet>
    <servlet-mapping>
        <servlet-name>chart</servlet-name>
        <url-pattern>/chart</url-pattern>
    </servlet-mapping>

    ...

</web-app>
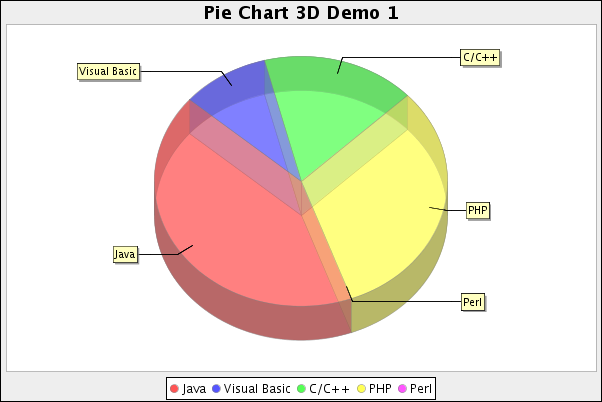
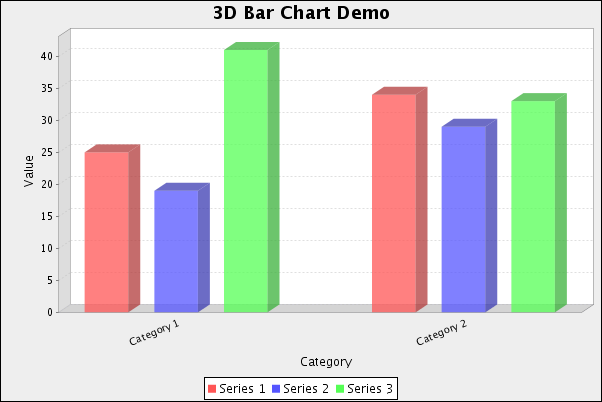
Chart types: For the moment only a few types are implemented. More will be added as they are requested/needed.
Available Chart types:
Screenshots: